
")
")
Aktuelle TEC (Total Electron Content) Werte
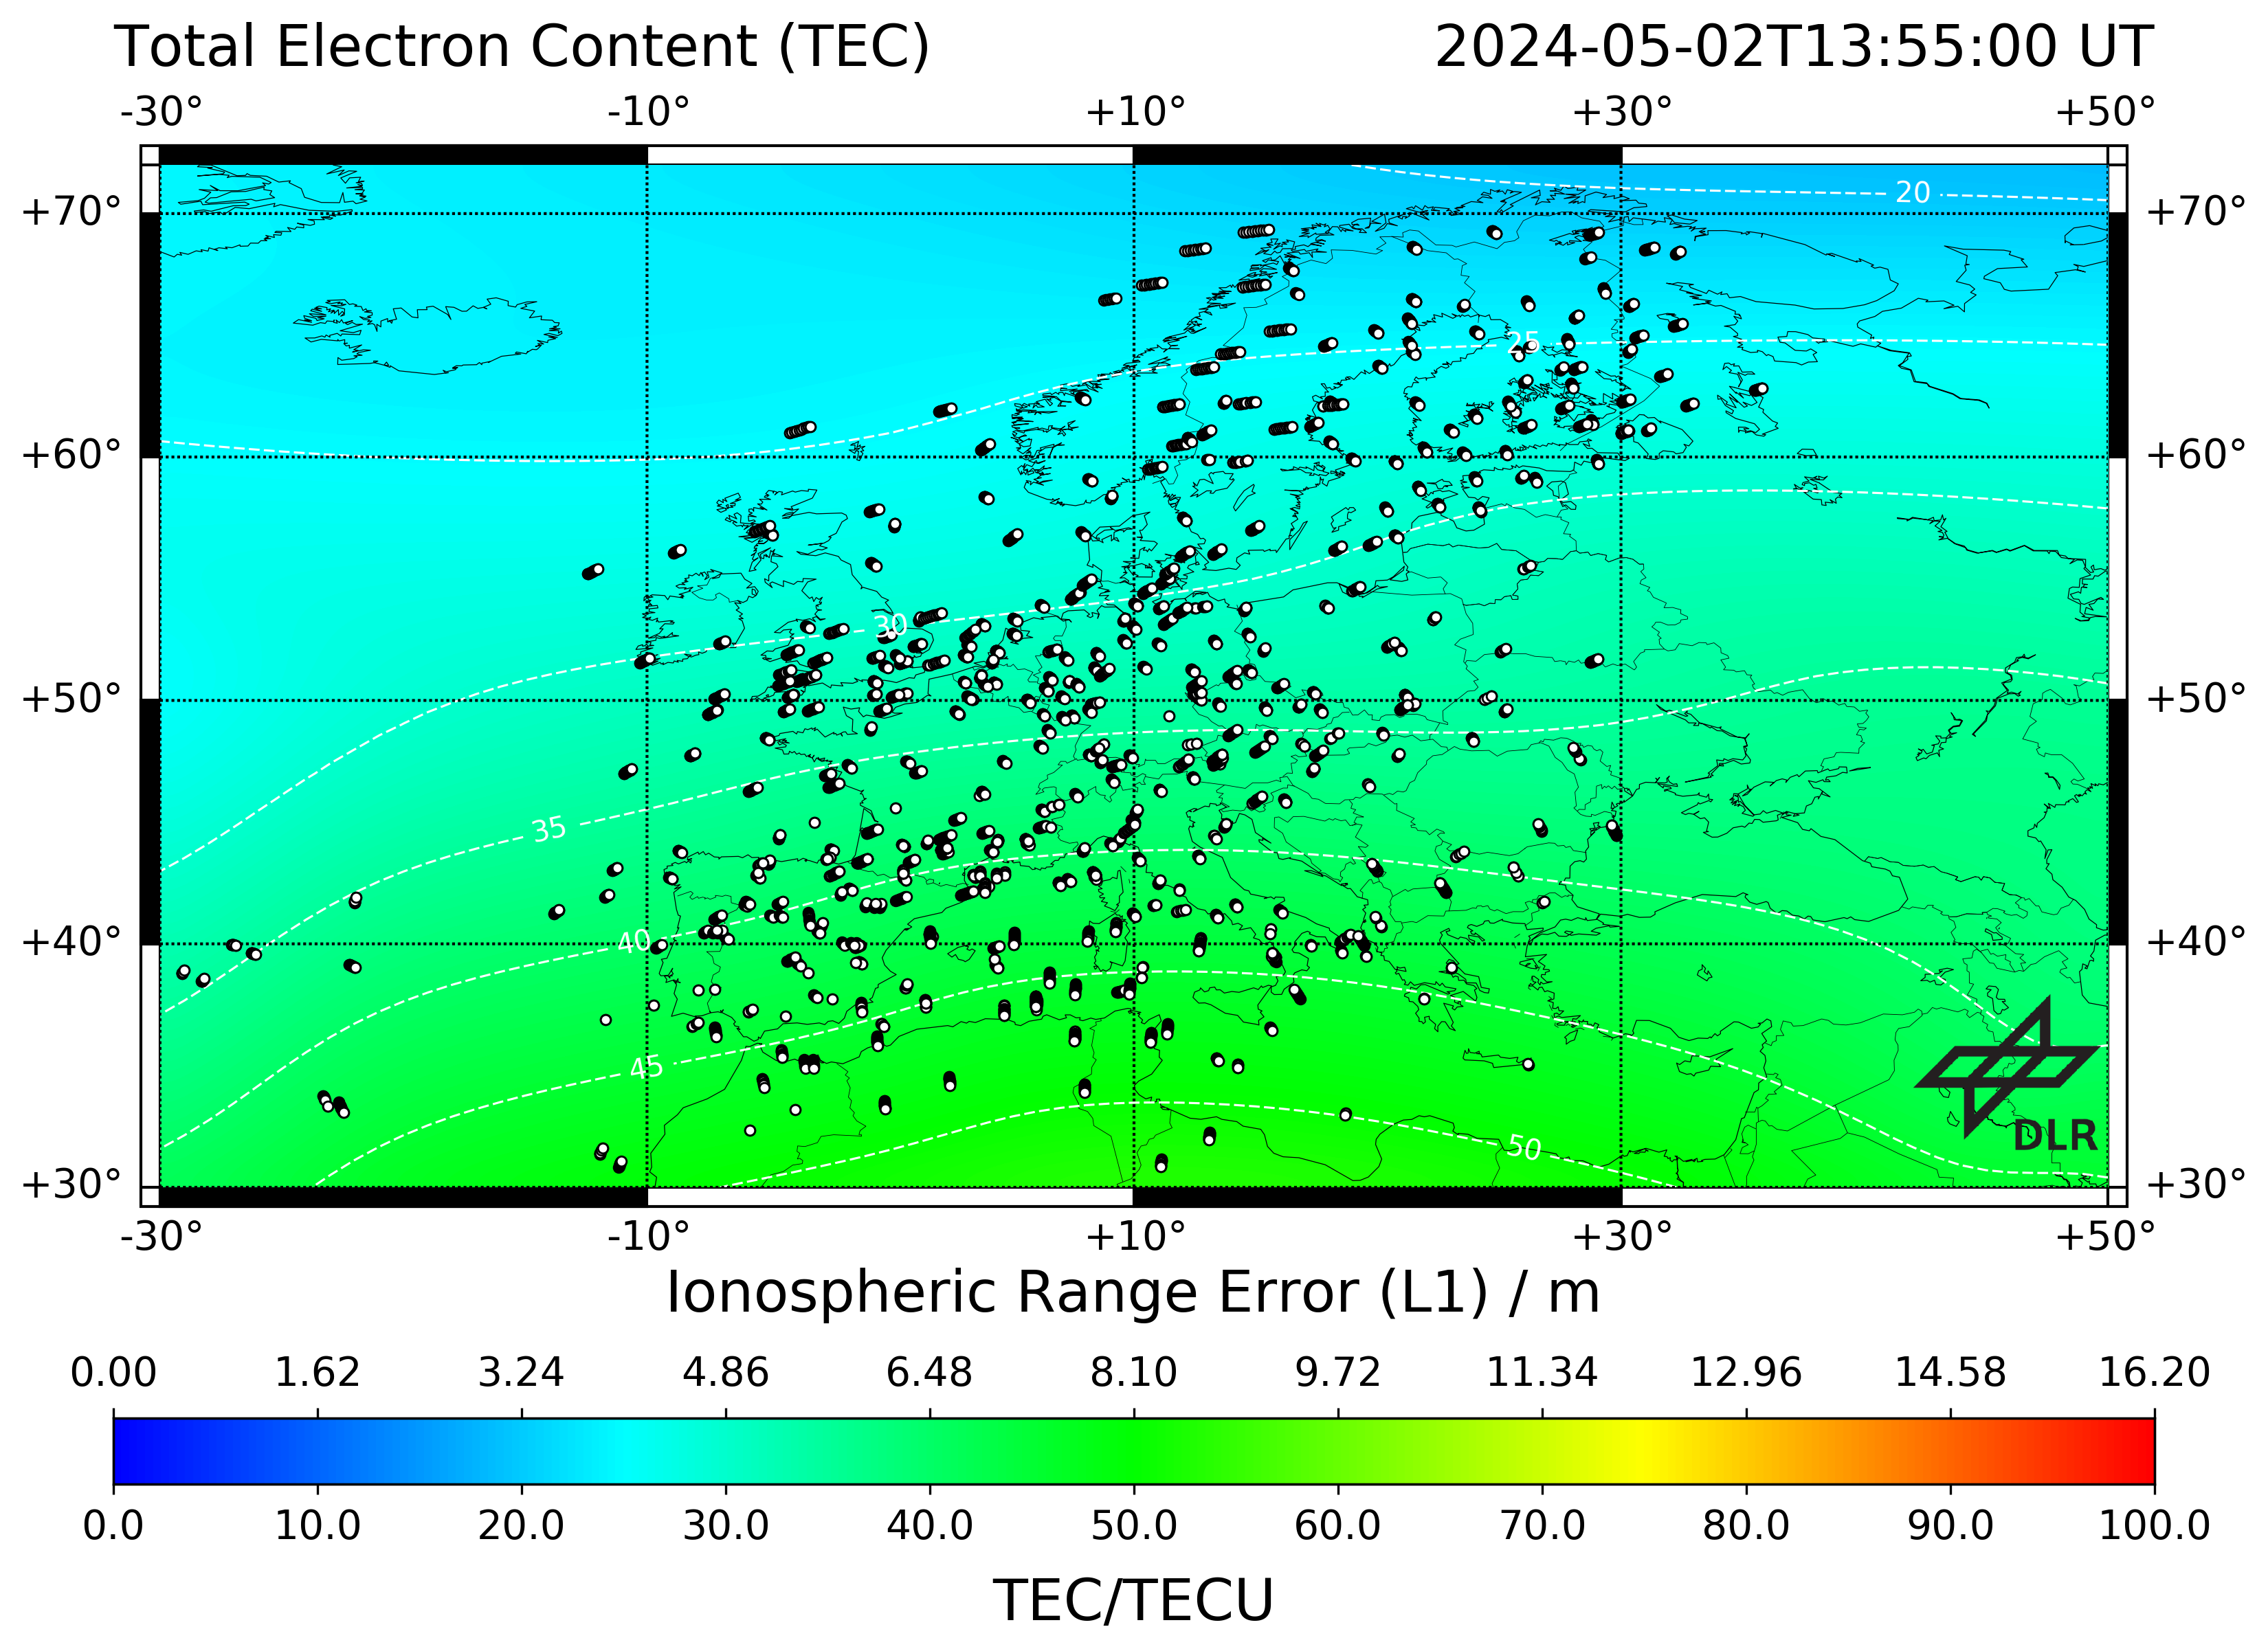
This TEC map is generated from ground based GNSS measurements assimilated into an empirical TEC model. GPS dual-frequency data is acquired as input from different providers in real-time, e.g. via the German Federal Agency for Cartography and Geodesy in Frankfurt. This data is preprocessed in order to derive calibrated slant TEC (STEC) and to update the coefficients of the Neustrelitz Total Electron Content Model (NTCM) serving as ionospheric background. Subsequently the calibrated STEC measurements are assimilated into NTCM (cf. Jakowski et al., 2011). The TEC is provided in TEC units (10^16 electrons per square meter) for a shell-height of 400 km.
Every 5 minutes a VTEC matrix with an ionospheric grid point spacing of 2° latitude x 2° longitude is generated and stored in ASCII format. Data is provided here with 15 minutes updated rate. Higher temporal resolution can be provided on request.
This product can be applied to help to improve the accuracy during GNSS positioning. Related validations can be found for instance in Minkwitz et al. (2014). The quality of the TEC map depends on the errors of the GNSS measurements. These errors are monitored through the production pipeline and displayed in a TEC error map. This TEC error map is provided as quality information along with the product.
Quelle: IMPC, https://impc.dlr.de/products/total-electron-content/near-real-time-tec/near-real-time-tec-map-europe
ROTI (Rate of TEC Index) für Europa

The Rate of TEC index (ROTI) is defined as standard deviation of the rate of TEC (ROT) assuming the ionosphere as a thin layer. Hence the index provides information about temporal ionospheric irregularities. DLR’s ROTI is calculated for the European region between 25°N – 75°N and 20°W – 45°E. As input GPS dual-frequency data is acquired from different providers, like IGS and EUREF, in real-time via the German Federal Agency for Cartography and Geodesy in Frankfurt. These data is used to calculate relative TEC as input for the ROTI processing. The standard deviation is calculated over a one minute window and the ROT is calculated each second.
The ROTI measurements are mapped into a regular grid (2°x2° lat/lon). Each grid cell presents the mean of the ROTI measurements located in this cell.